Resonant-ultrasound spectroscopy for studying anisotropic elastic constants of thin films
Thin films are extensively used for many devices including surface-acoustic-wave (SAW) devices, microelectronic-mechanical systems (MEMS), and so on. For designing these devices, mechanical properties of thin films are required. Especially, the elastic constants Cij of thin films are indispensable for designing the SAW devices for best performance, predicting thermally induced residual stress, and charactering the microscopic flaws.
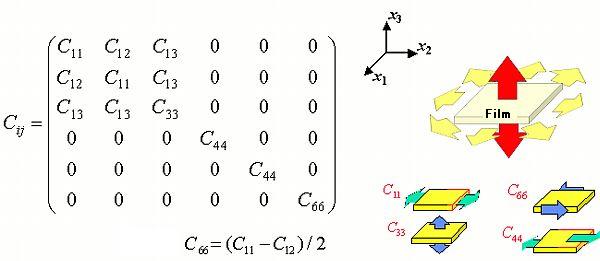
Thin films often show elastic anisotropy between the in-plane and out-of-plane directions because of the columnar structure, texture, residual stress, and local incohesive bonding (or microcracking). Then, they show transverse anisotropy and have five independent elastic constants denoted by C11, C33, C12, C13, and C44 with a Cartesian coordinate system, where the x3 axis is along the out-of-plane direction and the x1 and x2 axes lie parallel to the film surface.
However, most previous studies assumed thin films to be isotropic and evaluate one or two moduli with large error limits. Here, we develop an advanced technique to determine the films' Cij using resonance ultrasound spectroscopy (RUS). RUS determines the elastic constants from free-vibration resonance frequencies of solids. Although this approach was used to determine the Cij of bulk metals, composites, and piezoelectric materials, few applied this to thin films, because there are two difficulties. One is the accuracy of measuring free-vibration resonance frequencies and the other is mode identification with the observed resonance frequencies.
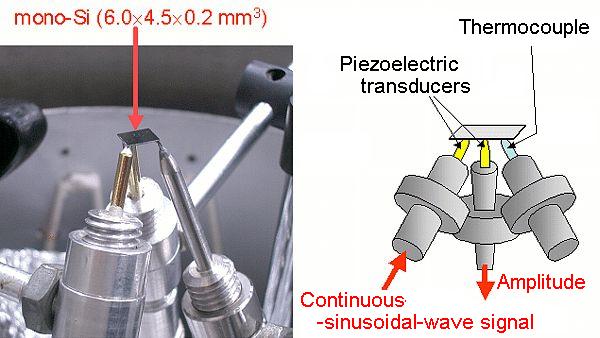
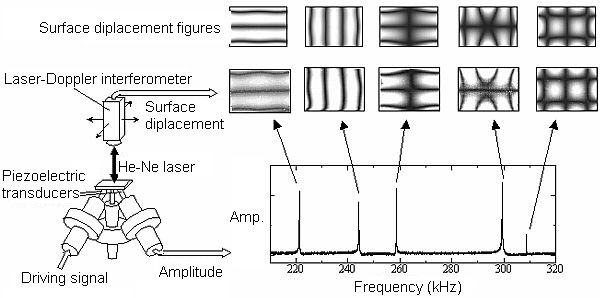
In the RUS method, accuracy of resultant elastic constants depends on their contributions (sensitivities) to the resonance frequencies. Generally, contributions of thin film elastic constants to the resonance frequencies are small and high accuracy of the resonance frequencies is indispensable for determining them. Previous RUS studies measured the resonance frequencies by sandwiching specimens in two transducers. Although it is a point-contact measurement, this setup constrains specimen deformation and changes the resonance frequencies from those of ideal free vibration. We have developed a piezoelectric tripod transducer to minimize this influence. Figure 3 shows our measurement setup. The piezoelectric tripod consists of two pinducers and a support stick. The specimen is put on the tripod. One pinducer generates a sinusoidal continuous-wave (cw) signal to vibrate the specimen and the other pinducer detects the oscillation amplitude. Sweeping the frequency of the cw signal and measuring the oscillation amplitude as a function of the frequency, the resonance spectrum is obtained, which consists of many peaks. Fitting the Lorentzian function around these peaks determines the resonance frequencies. Because the piezoelectric tripod requires no coupling agent and no external force except for the specimen own weight to achieve the acoustic coupling, it realizes ideal free oscillation. Resonance-peak heights vary depending on contacting positions of pinducers, but the resonance frequencies do not change. By measuring the resonance frequencies at a constant temperature 30 deg.C, reproducibility of the measurement is better than 10-4, which is much smaller than the contributions of the film Cij to the resonance frequencies.
Modes of the calculated resonance frequencies are known. We must find the identical modes from the measured spectrum to carry out the inverse calculation. However, there are a number of resonance frequencies and the peaks often overlap each other, making mode identification difficult. We accomplished unmistakable mode identification using laser-Doppler interferometer to obtain the out-of-plane displacement of the vibrating specimen at each resonance mode using laser-Doppler interferometry. A laser beam is focused on the specimen surface vibrating at the resonance frequency. The frequency of the reflected laser beam changes depending on the vibration frequency because of the Doppler effect. The surface displacement can be calculated from the frequency change. By comparing the measured displacement distributions and those calculated, we make mode identification, leading to the correct elastic constants.
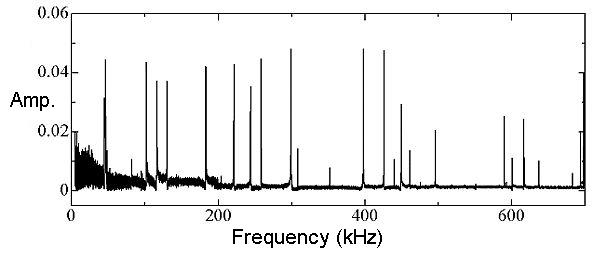
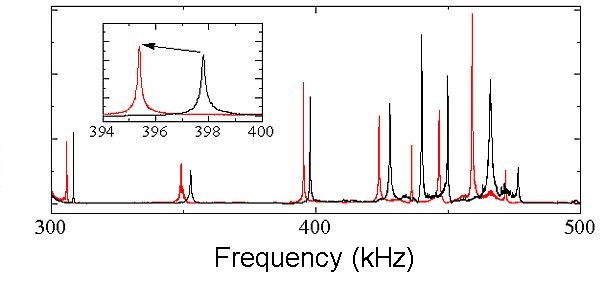
In above figure, black and red line denotes the resonance spectrum of Si substrate before and after the deposition of Co/Pt superlattice, respectively. Thickness of the substrate and Co/Pt superlattice is 200 micron and 1 micron, respectively. Although thickness ratio of the film to the substrate is 0.5 %, the resonance frequencies decreased more than 1 % after the deposition. These frequency shits are larger than the measurement accuracy of the resonance frequencies, and we can determine the reliable elastic constants from the frequency shifts.
References
* H. Ogi, K. Sato, T. Asada, and M. Hirao, J. Acoust. Soc. Am. 112 (2002) 2553.
- H. Ogi, G. Shimoike, M. Hirao, K. Takashima, and Y. Higo, J. Appl. Phys. 91 (2002) 4857.
- N. Nakamura, H. Ogi, and M. Hirao, Acta Mater. 52 (2004) 765.
- N. Nakamura, H. Ogi, M. Hirao, and T. Ono, J. Appl. Phys. 97 (2005) 013532