Resonance Ultrasound Microscopy
Consider an oscillator. When it is in contact with a solid, its resonance frequency varies from the value at the free vibration. This frequency change occurs because the local contacting region of the solid is deformed, representing the local stiffness of the contacting material. Similarly, the damping constant of the oscillating oscillator will be increased by the contact because of the local damping of the solid. Thus, we can evaluate the local stiffness and local damping by measuring accurately the resonance frequency and damping constant of the oscillator.
However, quantitative and absolute evaluation of the local stiffness and local damping have never been straightforward, because the conventional oscillator involves significant contacts with the supporting material, electrodes, wires for exciting and detecting the vibrations, and so on. Therefore, the trivial effect of the contact with the solid specimen on the vibration cannot be separately evaluated.
We have however succeeded in the quantitative and absolute measurement of the local stiffness and local damping of materials by developing the langasite oscillator shown below [1-3].
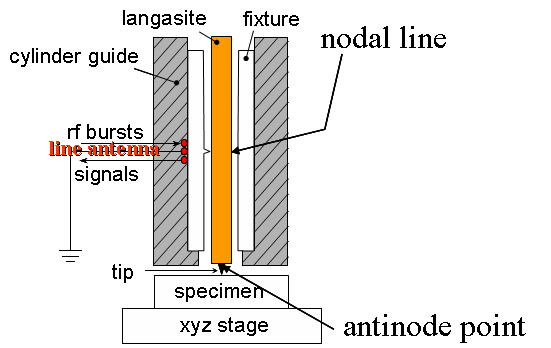
A rectangular-parallelepiped monocrystal-langasite oscillator touches a specimen through a monocrystal diamond tip. We hold it by a fixture at the nodal line of the vibration so as to give little influence on the vibration from holding. The fixture and oscillator are placed in a cylindrical guide, which allows only the vertical movement of the oscillator. Gravity applies a constant biasing force for contact, being independent of the surface roughness. A line antenna is placed near the crystal to excite and detect the longitudinal vibrations via the piezoelectric effect without electrodes.
Thus, the langasite oscillator is acoustically isolated form any other contacts except for that with the specimen, yielding absolute and quantitative measurements.
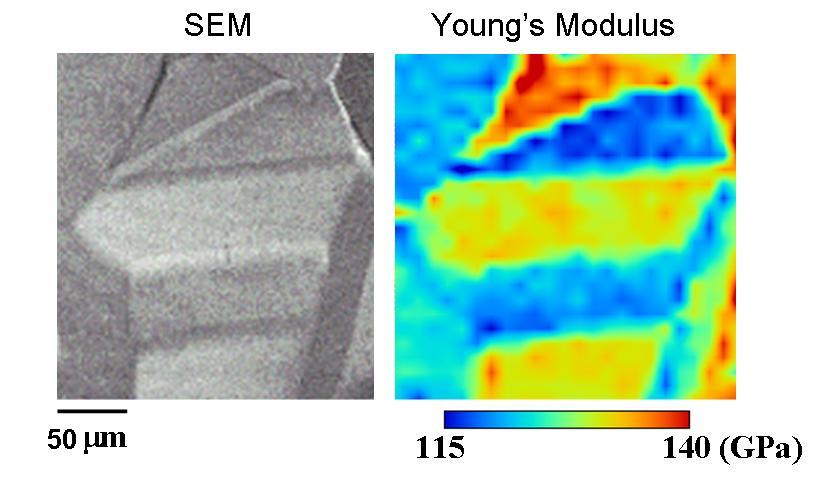
Above figures show the microstructure of polycrystalline copper obtained by SEM(left) and stiffness image measured by our RUM. The RUM image clearly shows the stiffness change due to the grain orientation. It is interesting to note that stiffness varies even within a single grain.
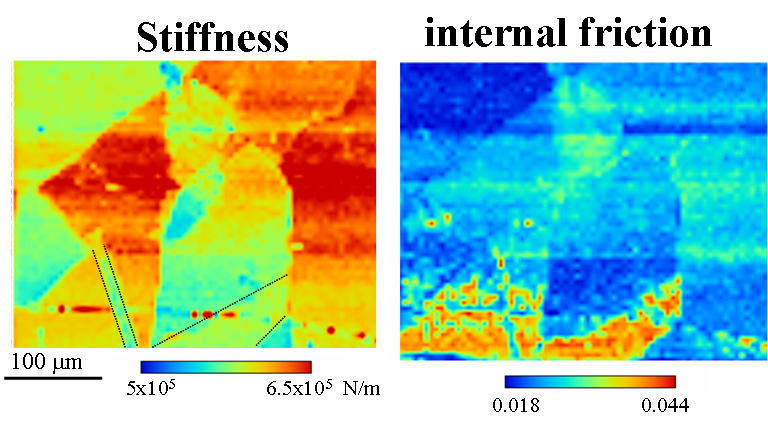
Above figures compare the stiffness image (left) and damping image (right) obtained by the RUM. Very high damping is seen in the grain involving twining boundaries.
[1] H. Ogi, H. Niho, and M. Hirao, "Elastic-Stiffness Distribution on Dual-Phase Stainless Steel Studied by Resonance Ultrasound Microscopy", Acta Materialia, 54, 4143-4148 (2006).
[2]H. Ogi, M. Hirao, T. Tada, and J. Tian, "Elastic-stiffness distribution on polycrystalline copper studied by resonance ultrasound microscopy: Young's modulus microscopy", Phys. Rev. B, 73, 174107 (2006).
[3]H. Ogi, H. Niho, and M. Hirao, "Internal-friction mapping on solids by resonance ultrasound microscopy", Appl. Phys. Lett. 88, 141110 (2006).